On this page
Behind the Numbers: My Research in The Business Times' Front-Cover Property Feature
How a question from managing my family's property portfolio grew into a study of more than 630,000 transactions, and the unexpected patterns I'm investigating next.
Vairavan Shanmugam | October 2026
On 3 October 2026, The Business Times featured Many happy returns for resale homes on its front cover. Written by Ry-Anne Lim, the full story ran across pages 9 to 11 of the paper's Brunch section, following its online publication the day before.
At the centre of it was a question I had been trying to answer for months: does buying a new-launch condominium really deliver better investment returns than buying resale?
Seeing the research in print, let alone promoted on the front cover, was something I hadn't expected. What I appreciated even more was how Ry-Anne brought the story together. She made room for the numbers without letting them overwhelm the people and decisions behind them. The feature explored what buyers might be paying for when they choose a new home, brought in other experts' evidence and viewpoints, and treated the question with the nuance it deserved.
I really enjoyed working with Ry-Anne as the article developed, and I'm grateful to her and BT's editorial, property and production teams for the care they put into it. The other contributors made the finished piece stronger too.
A week later, on 10 October, BT returned to the subject with New launch or resale unit? Here's a guide for homebuyers, drawing on findings from the original feature. Since then, the research has also been shared and discussed through other online publications, professional and social platforms, and independent property commentary.
That's been rewarding to watch. I don't expect everyone to agree with the same interpretation. In fact, a good discussion often starts precisely where people disagree. What matters to me is that the conversation is engaging with evidence rather than simply repeating the same assumptions.
The question that wouldn't go away
My interest began while helping manage my family's real estate investment portfolio. That involved analysing potential purchases, going for property viewings, reviewing market data, and speaking with property agents and other industry professionals.
One piece of advice came up again and again: if you're buying for capital appreciation, a new launch is generally the smarter choice.
The usual argument sounds appealing. Buy early, benefit as the development takes shape, and sell for more once it's completed. There are certainly buyers who have done very well that way.
But new launches can also come with substantial price premiums. Why would paying more at the start necessarily produce a better return at the end?
I wasn't convinced buying new was a bad idea. I just found it strange that a claim with such significant financial implications could be accepted so readily on the strength of a few success stories. I wanted to see how it held up across thousands of actual purchases and subsequent sales, not just the examples we tend to hear about.
So I went into the data.
What the numbers showed
Using URA REALIS records, I analysed 630,541 private residential transaction records spanning 1995 to June 2026. The repeat-sale exercise produced 166,970 qualifying purchase-and-subsequent-resale pairs, each with a holding period of at least three years.
Across those completed ownership spells, the median annualised capital return was 3.7% for resale-entry buyers, compared with 2.7% for new-sale-entry buyers. Resale also had the higher median across the CCR, RCR and OCR, both broad tenure classes, and the principal exit-period comparisons.
That supported my original suspicion. But it didn't fully explain it. Why the gap? Did the premium at entry matter? Was it partly about when and where people bought? And, just as importantly, when did buying new actually work out better?
Those questions took the project well beyond the first headline result.
How it became part of BT's story
I first approached BT in June 2026 with an opinion submission based on my early findings. I hoped to bring quantitative evidence into a debate that too often seemed to rely on familiar market narratives.
BT asked for more supporting charts and data. I started pulling those together and ended up going much deeper than planned. The sample grew, the breakdowns multiplied, and I kept checking whether the main result held under different ways of looking at the market.
In July, BT said its property team was working on a related story and thought my analysis could contribute. Ry-Anne got in touch in August, and the conversation moved towards a wider feature. What started as an independent opinion submission had become part of a much richer investigation, one I was glad to contribute to.
And that was exactly the point of wanting to publish it.
The other patterns I couldn't ignore
One thing I didn't expect was how many other questions would emerge while I was working through the data for the BT piece. Some were at least as interesting as the headline result.
I've already started digging further into four of them. What follows is a first look at what the existing analysis shows, why each result caught my attention, and where I'm taking the research next.
1. When does buying new actually come out ahead?
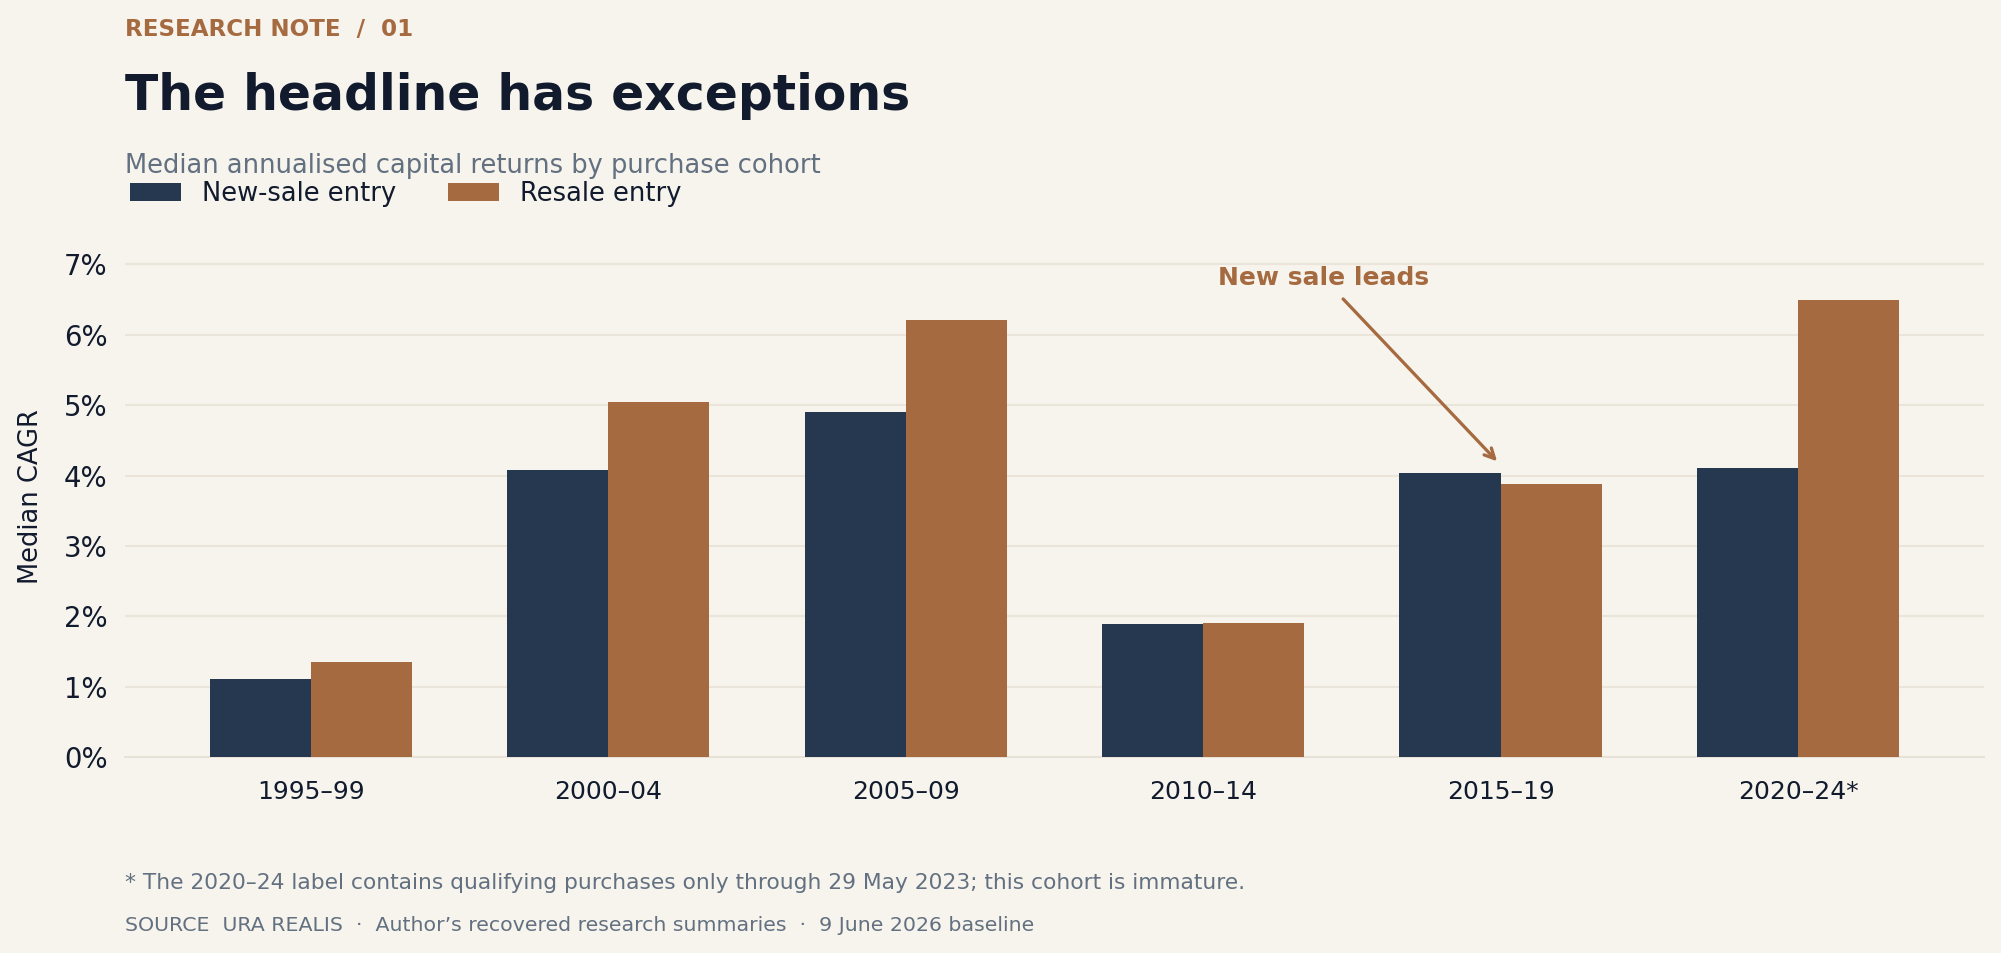
What I found. Resale-entry buyers had the higher median across the full study, but not in every purchase cohort. For properties purchased in 2015–2019 that subsequently qualified for the sample, the median annualised return was 4.03% for new-sale entry versus 3.88% for resale entry. Some regional cohorts and postal districts also favoured new sales.
Why that's interesting. It suggests that the more useful question may not be simply new or resale?, but when, where, and under what conditions? Averages across thirty years can conceal very different buying environments.
What I'm looking at next. I'm examining purchase timing, holding periods, location, project characteristics and the comparability of the properties involved. The goal is to see which exceptions remain once we're comparing more similar circumstances. The newest purchase cohort is not fully mature, so that limitation matters too.
2. Why were losses so pronounced at the expensive end of the CCR?
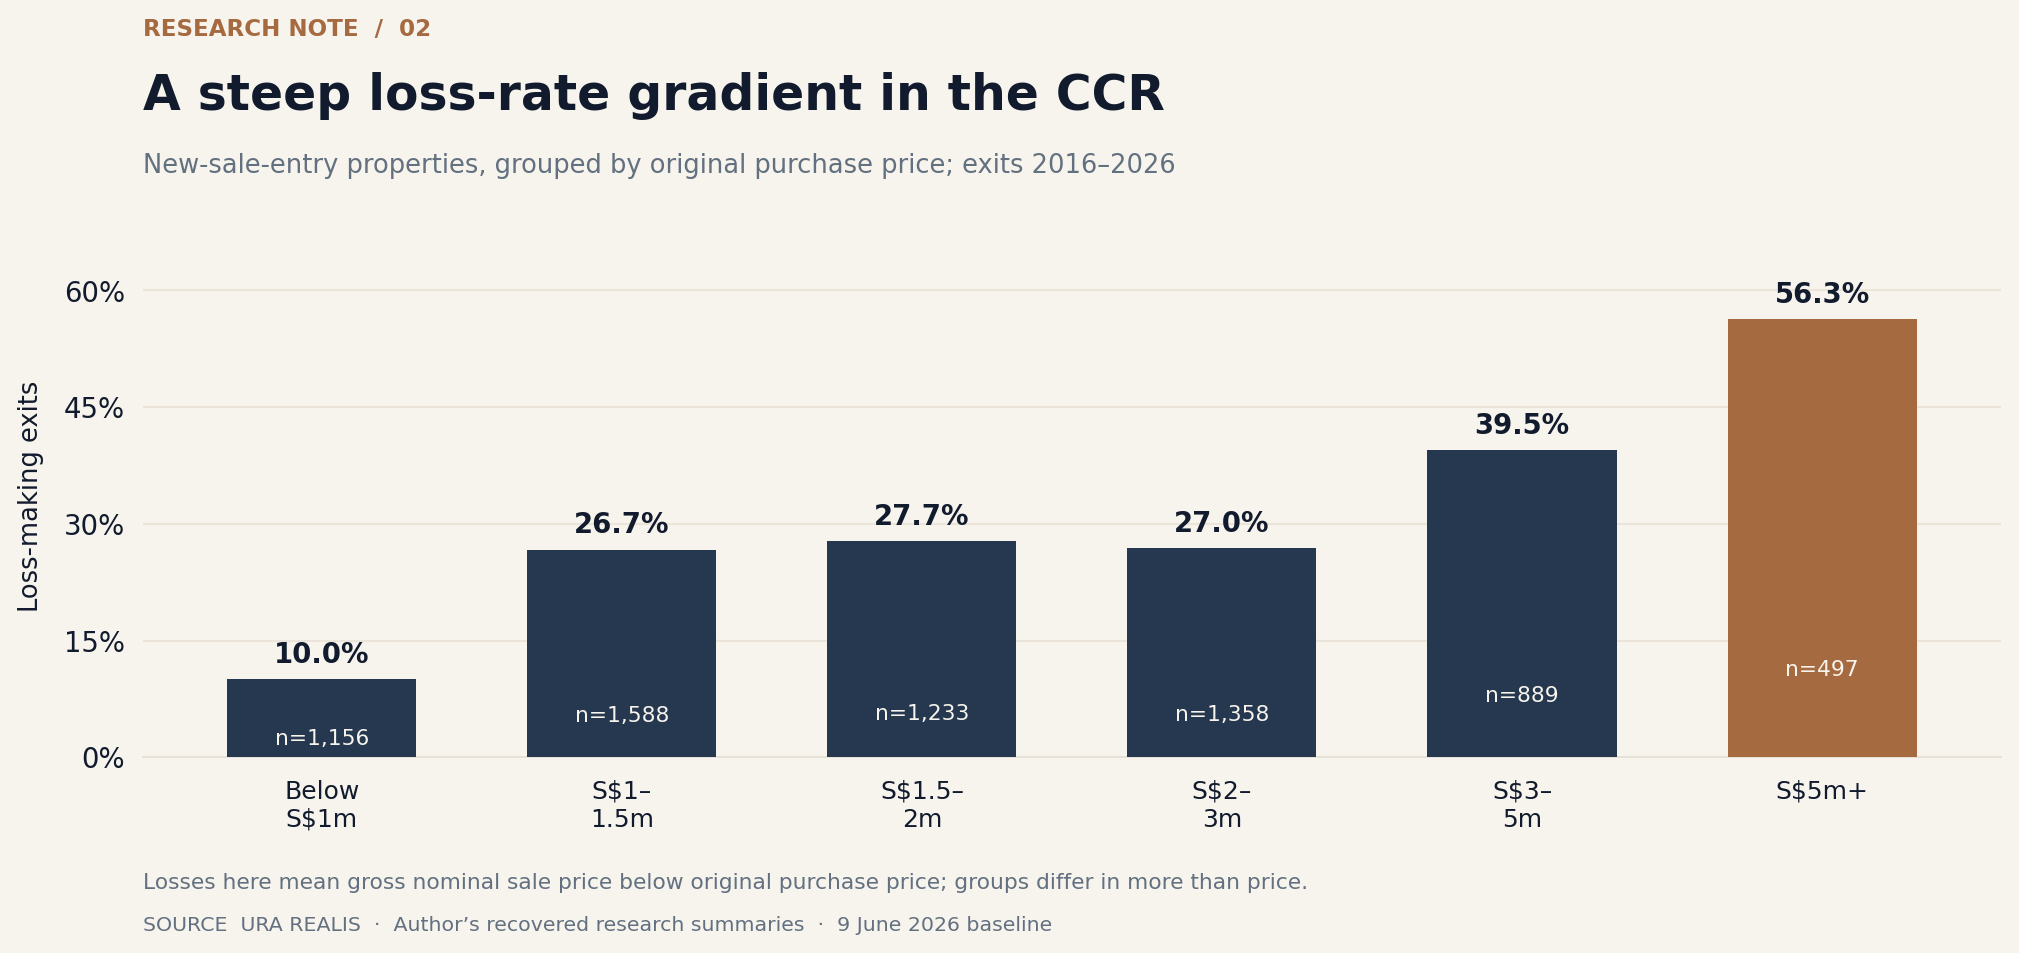
What I found. Among qualifying CCR properties purchased through new sales and resold from June 2016 to June 2026, 10.0% of those originally purchased below S$1 million were sold at a nominal loss. For properties originally bought at S$5 million or more, it was 56.3%. The difference was visible across broad tenure categories, although some individual groups had small samples.
Why that's interesting. Prime properties are often associated with prestige, scarcity and capital preservation. Yet these realised exits show substantial variation in outcomes by entry-price segment. There may be a story here about purchase vintages, market cycles and the premiums buyers were willing to pay.
What I'm looking at next. I'm examining whether the pattern survives more careful comparisons by purchase year, project, unit characteristics and tenure, as well as looking beyond the frequency of losses to their magnitude. A descriptive relationship between price and losses is not proof that a high price caused the loss.
3. Does older really mean worse?
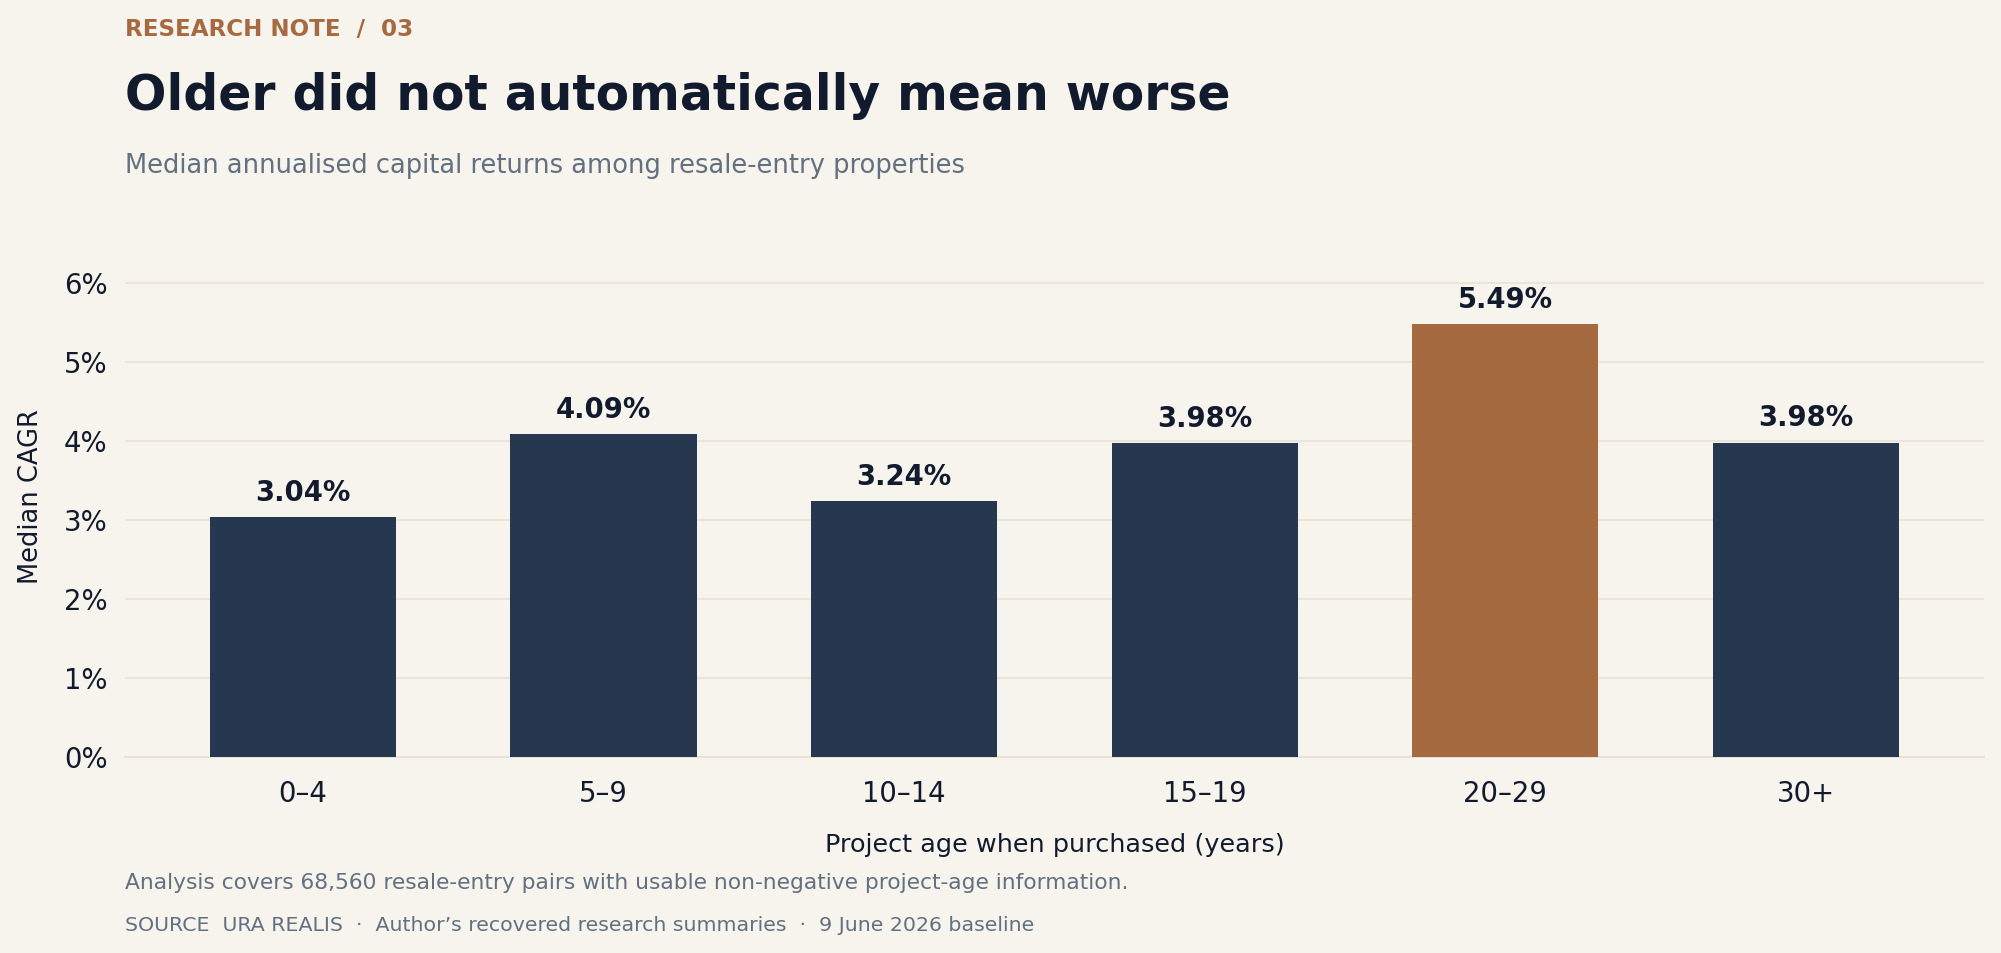
What I found. Among resale-entry properties with usable age records, homes aged 20–29 years at purchase recorded a 5.49% median annualised capital return. Properties aged 0–4 years recorded 3.04%. The older group also had a lower observed nominal loss rate, 7.3% versus 15.4%.
Why that's interesting. We often talk about ageing properties in terms of depreciation, maintenance and lease decay. Those things matter, but the price at which someone enters the market matters too. The relationship isn't linear, and older isn't automatically better either.
What I'm looking at next. I'm separating project age from remaining lease and examining how location, property size, purchase vintage and entry price might explain the differences. I want to understand the pattern before drawing conclusions about whether there is any meaningful age-related advantage.
4. Were CCR losses just a handful of bad developments?
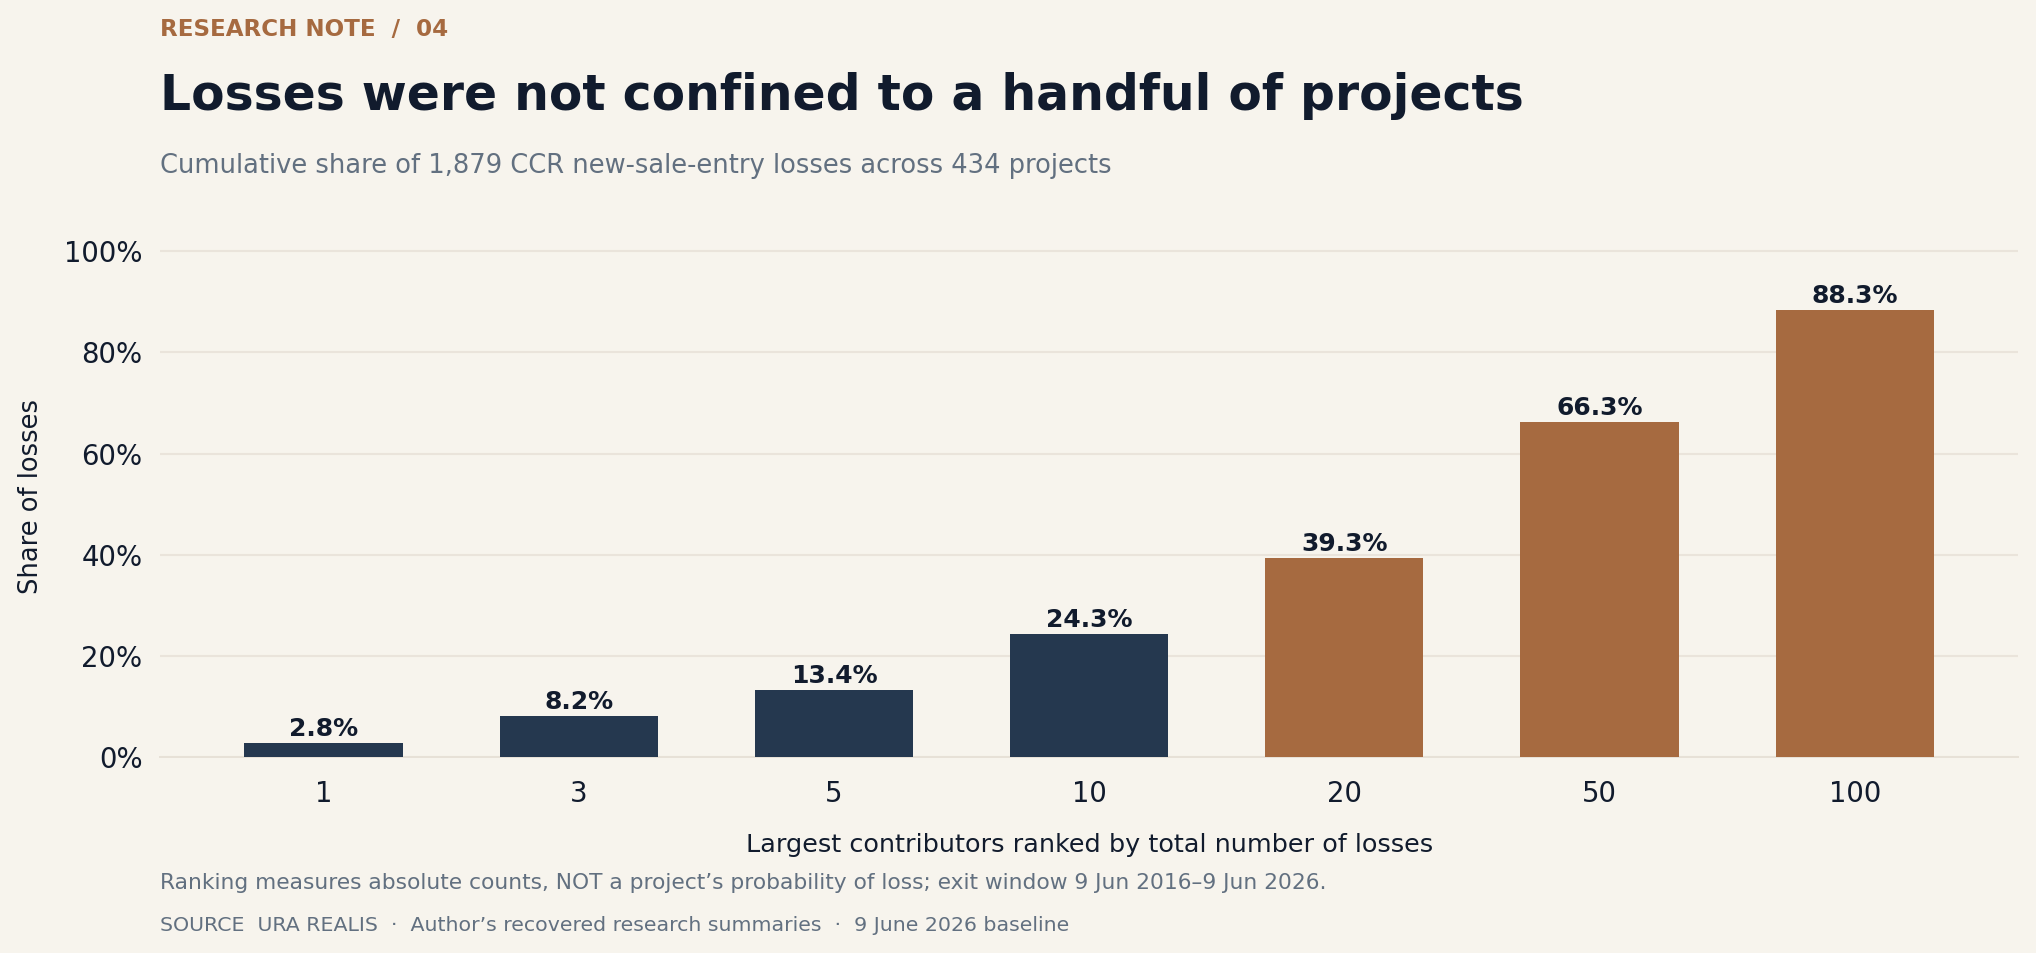
What I found. In the relevant CCR sample, the ten developments contributing the most losses accounted for 24.3% of the 1,879 loss-making exits. There were 434 developments represented, and it took 107 of them to account for more than 90% of losses.
Why that's interesting. It's tempting to explain disappointing investment outcomes by pointing to a few familiar projects. These numbers suggest the distribution was broader. But there's an important catch: contributing many losses is not the same as having a high probability of loss. Larger developments naturally have more opportunities to appear in the count.
What I'm looking at next. I'm exploring project size, transaction volume, purchase periods, price positioning and development-level characteristics to understand which factors account for the observed differences. That should provide a more meaningful picture than a simple list of projects with the most losses.
More to come
These charts come from the descriptive work already completed for the wider research. They are early findings, not four finished standalone studies.
I've begun following up on the questions they raise, and I'll publish the deeper analysis, additional charts, methods and limitations as each piece takes shape. Some of the initial patterns may hold up; others may change when the comparisons become more rigorous. That's part of the process.
Keep an eye on my research page. There's more coming from this dataset.
For anyone who wants to explore the work already done, the supplementary report and technical evidence pack contain the fuller breakdowns and backing tables.
Better evidence, not a verdict on anyone
I want to be equally clear about what this research is not trying to do.
I'm not a property agent, and I don't undertake research to steer people towards a particular transaction, business or market position. This study was initiated independently, without commercial direction or pressure to reach a particular conclusion.
It also isn't an argument against developers, agents, sellers, buyers, financial institutions, consultants or anyone else involved in the housing market. There is no single “other side” here. People approach property with different responsibilities, incentives, constraints and goals.
A developer's new project may be attractive for very real reasons. An agent's local knowledge and guidance can be extremely valuable. A family's decision might prioritise space, schools, accessibility, a payment schedule or the experience of living in a newer home. A policymaker might be interested in affordability or market stability. None of those objectives is reducible to a single return statistic.
Nor should a finding that resale-entry buyers historically earned higher median capital returns be mistaken for a claim that every resale purchase is sensible, or that every new launch is overpriced.
My aim is to test claims, including my own assumptions, and make the results available in a form people can actually use. If a finding challenges a familiar narrative, that doesn't make the people repeating it dishonest. And if the evidence happens to support an established view, that's equally worth reporting.
I believe better information helps the whole market: households making decisions, agents advising clients, developers understanding what buyers value, financial institutions assessing risk, and researchers or policymakers trying to understand how the system works.
That commitment to impartiality and quantitative rigour is part of why I chose to pursue a PhD in Real Estate at NUS Business School. The research began before my doctoral studies, but the academic environment gives me a chance to test explanations more deeply and put my methods under greater scrutiny. A university affiliation isn't proof of impartiality. The work itself has to demonstrate it.
Keeping the conversation going
What I've enjoyed most about this experience is that the findings didn't stay within a research file. They reached people who might be making decisions, questioning received advice or simply wanting a clearer picture of the market.
That's also what I've tried to do through my previous media commentary, public talks and briefings: make complicated housing and market questions understandable without losing the evidence that gives the explanation its value.
If you'd like to see more of that work, you can explore my previous media appearances, speaking engagements and talks, and other research projects.
My interests extend beyond private-home returns to housing policy, urban economics, household finance, geospatial analysis and how markets and institutions shape everyday decisions. I'm always glad to hear from journalists, academic researchers, policymakers, industry professionals and organisations interested in independent empirical work, interviews, presentations or collaboration.
If there's a question you think deserves a closer look, get in touch. I'd love to hear it.
And once again, thank you to Ry-Anne and everyone at BT who helped bring this story to readers. I hope it encourages more people to ask a simple question before accepting familiar investment claims: what does the evidence actually show?
Further reading
- The Business Times: Many happy returns for resale homes (online, 2 October 2026)
- The Business Times: New launch or resale unit? Here's a guide for homebuyers (10 October 2026)
- Supplementary Research Report (PDF)
- Evidence & Methods (PDF)
Research and investment disclaimer
This is independent, observational research for education and public discussion. It does not constitute financial or investment advice, and it should not be construed as such. The figures describe historical realised capital returns, not forecasts or causal estimates. They omit rental income, financing, taxes, transaction and ownership expenses, inflation and unsold holdings. Individual circumstances may differ materially. Before making a property decision, conduct your own due diligence and consider engaging a property agent registered with Singapore's Council for Estate Agencies (CEA), as well as appropriately qualified financial or legal advisers where relevant.