Research question
Do buyers entering through new sales earn higher realised capital returns than those buying resale? I compared observed purchases and subsequent resales of the same physical units, rather than changes in project-level launch prices.
June 2026 data and method
The expanded study uses 630,541 URA REALIS non-landed residential transaction records, covering 1 January 1995 to 9 June 2026, including Executive Condominiums (ECs). It produces 166,970 qualifying adjacent same-unit buy-sell pairs:
- 96,953 new-sale-entry pairs: purchase through New Sale, exit through Resale.
- 70,017 resale-entry pairs: purchase through Resale, exit through Resale.
A unit with several observed transactions can contribute several adjacent pairs. These are ownership spells, not 166,970 distinct homes or investors. Sub-sale-related paths are excluded from the headline sample.
The minimum holding-period screen is 1,095 days, approximately three years. Holding years are calculated as days divided by 365.25; 28 qualifying pairs consequently have a measured holding period just below 3.0 years. I use the implemented day threshold rather than describe it as an exact three-calendar-year rule.
The return measure is gross nominal transaction-price-only CAGR: (sale price / purchase price)^(1 / holding years) - 1. Nominal capital gain is sale price minus purchase price. Neither measure is net profit or a total investor internal rate of return.
Headline findings: EC-inclusive sample
Across the June sample, median annualised capital returns were 2.7% for new-sale entry and 3.7% for resale entry, a rounded gap of 1.0 percentage point per year. The underlying medians are 2.718168% and 3.672343%.
Median nominal capital gains were S$234,536 for new-sale entry and S$305,000 for resale entry, before ownership and transaction costs.
The regional median CAGRs were:
| Region | New-sale entry | Resale entry |
|---|
| Core Central Region (CCR) | 1.9% | 2.8% |
| Rest of Central Region (RCR) | 2.6% | 3.7% |
| Outside Central Region (OCR) | 2.9% | 4.0% |
Resale entry also had the higher median in the broad tenure and five-, ten- and twenty-year exit-window comparisons reported in the June evidence pack. This does not mean it led in every purchase cohort, project or individual transaction.
These windows are defined by resale exit date, anchored to 9 June 2026, rather than purchase date or a fixed holding duration:
| Exit window | Qualifying resale dates |
|---|
| Past five years | 9 June 2021–9 June 2026 |
| Past ten years | 9 June 2016–9 June 2026 |
| Past twenty years | 9 June 2006–9 June 2026 |
The Evidence & Methods report, S15_Master, pp. 79–90 preserves the tenure, region and entry-type breakdowns by window. These are nested historical samples of qualifying exits, not predictions for five-, ten- or twenty-year investments.
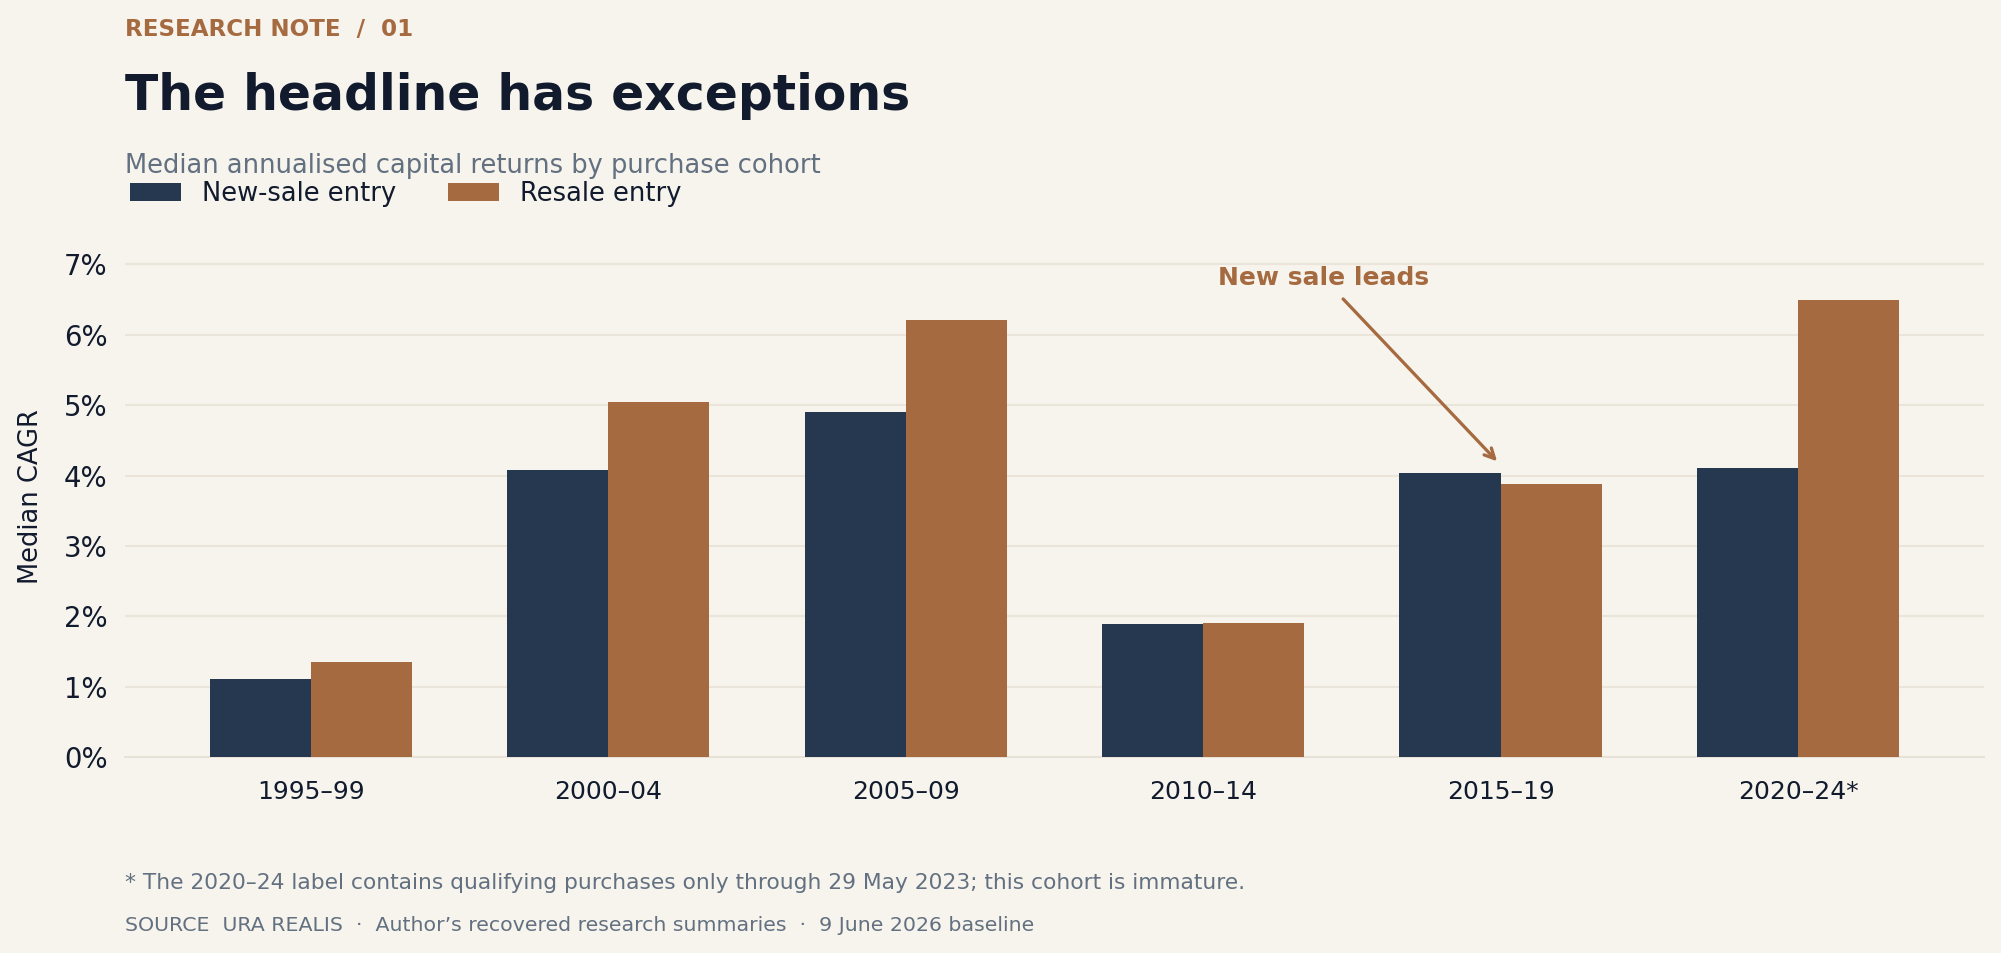
A purchase-cohort exception: among qualifying pairs purchased in 2015–2019, new-sale entry had a 4.03% median CAGR (13,590 pairs) versus 3.88% for resale entry (10,657 pairs). The groups differ in holding periods and property mix; this is not a controlled effect of buying new. See F01 and S01_Cohorts in the evidence report, and the chart in the personal article.
For CCR pairs sold from 9 June 2016 to 9 June 2026, nominal loss rates were 28.0% for new-sale entry and 14.9% for resale entry. This window is defined by the sale date, not the purchase date.
A separate EC-excluded sensitivity
The headline population includes 19,585 EC pairs, all classified as leasehold. ECs have different eligibility and resale rules from conventional private condominiums, so I report their inclusion explicitly.
Removing ECs leaves 147,385 pairs: 81,418 new-sale-entry and 65,967 resale-entry. In this separate June sensitivity, median CAGRs are 2.37% for new-sale entry and 3.60% for resale entry. The resale advantage remains, but these numbers describe a different population and do not replace the EC-inclusive headline.
Regional entry-price comparisons
For 9 June 2021 to 9 June 2026, the EC-inclusive regional median new-sale PSF premiums over resale were 40.6% in CCR, 48.0% in RCR and 50.0% in OCR.
This calculation uses all eligible transactions in the window with positive PSF and sale type New Sale or Resale, excluding Sub Sale. It is separate from the completed-pair sample. The premium is median new-sale PSF divided by median resale PSF, minus one. It is a ratio of regional medians, not a matched valuation controlling for age, size, floor, stack or exact location.
The EC-excluded premium sensitivity is 40.6% in CCR, 47.9% in RCR and 55.0% in OCR. Entry-price differences are one possible explanation to investigate; these descriptive comparisons do not identify a causal mechanism.
Supporting coverage
The expanded study contributed to The Business Times’ Many happy returns for resale homes, published online on 2 October 2026 and promoted on the 3 October print front cover, with the feature in Brunch pages 9-11. A homebuyer guide followed on 10 October.
Read how the research developed and the questions I am pursuing next. This was independently initiated research featured in journalism; it is not a peer-reviewed publication, a BT-commissioned study or a NUS-sponsored project.
Supporting reports
These supplied PDFs reproduce retained aggregate research summaries. Their June headline population includes ECs; their “three years” wording is shorthand for the 1,095-day filter explained above. The separate non-EC sensitivity remains identified on this page. Summary-table reconciliation in the reports is not a new raw-data replication. The supplementary report covers June’s expanded analysis and does not replace the separate May freehold paper.
Interpretation and limits
These are historical, descriptive comparisons of realised exits. They omit unsold holdings and do not identify causal effects or forecast returns for a particular purchase. Market timing, location, property characteristics and selection into sale can affect comparisons.
The calculations exclude rental income, vacancy, mortgage interest, taxes, maintenance, renovation, stamp duties, agent commissions, legal costs, CPF opportunity costs and inflation. New launches can also offer layouts, facilities, payment schedules and owner-occupation value that a price-only return statistic does not capture.
The findings are for research and public discussion, not financial or investment advice.