In brief: Produced repeatable monthly price comparisons and town-level summaries with less manual report assembly.
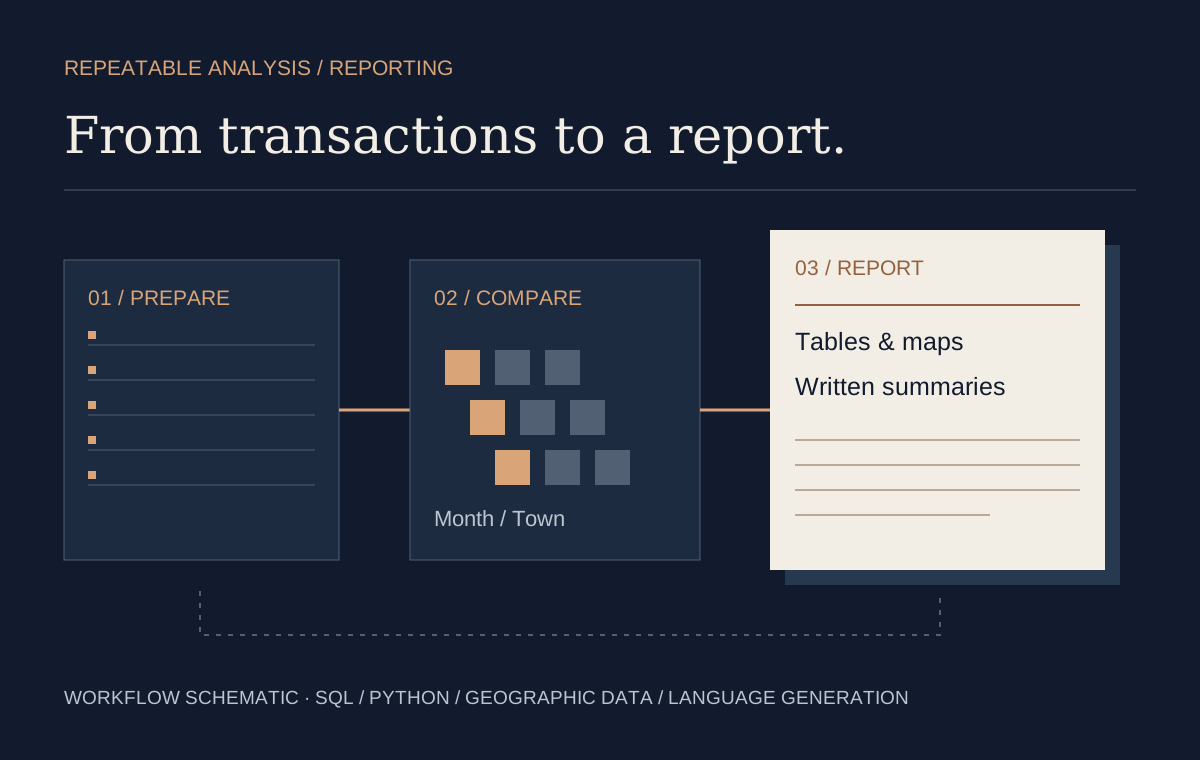
Conceptual workflow from HDB transactions to monthly comparisons, maps and written reports
On this page
Task
Monthly HDB resale reporting required repeated data cleaning, comparisons with earlier periods, and written summaries. I built a workflow to make those steps repeatable.
Workflow
SQL retrieved resale transactions over a rolling time window.
Python standardised town names, calculated monthly medians, and joined geographic reference data.
Town-level spatial data supported comparisons across locations.
A language-generation step converted the processed results into narrative summaries.
Output
The workflow compared the latest month’s median prices with earlier periods and identified differences across HDB towns. It combined numerical tables and geographic context with descriptive summaries, reducing the manual work involved in recurring reports.
This page documents the design and historical outputs of the workflow; it does not establish that the original monthly schedule is operating today.
Original project output ↗
The cover above illustrates the method. This screenshot preserves an output from the original project.
Original HDB report showing price comparisons and a town-level mapBack to all research